Hi!
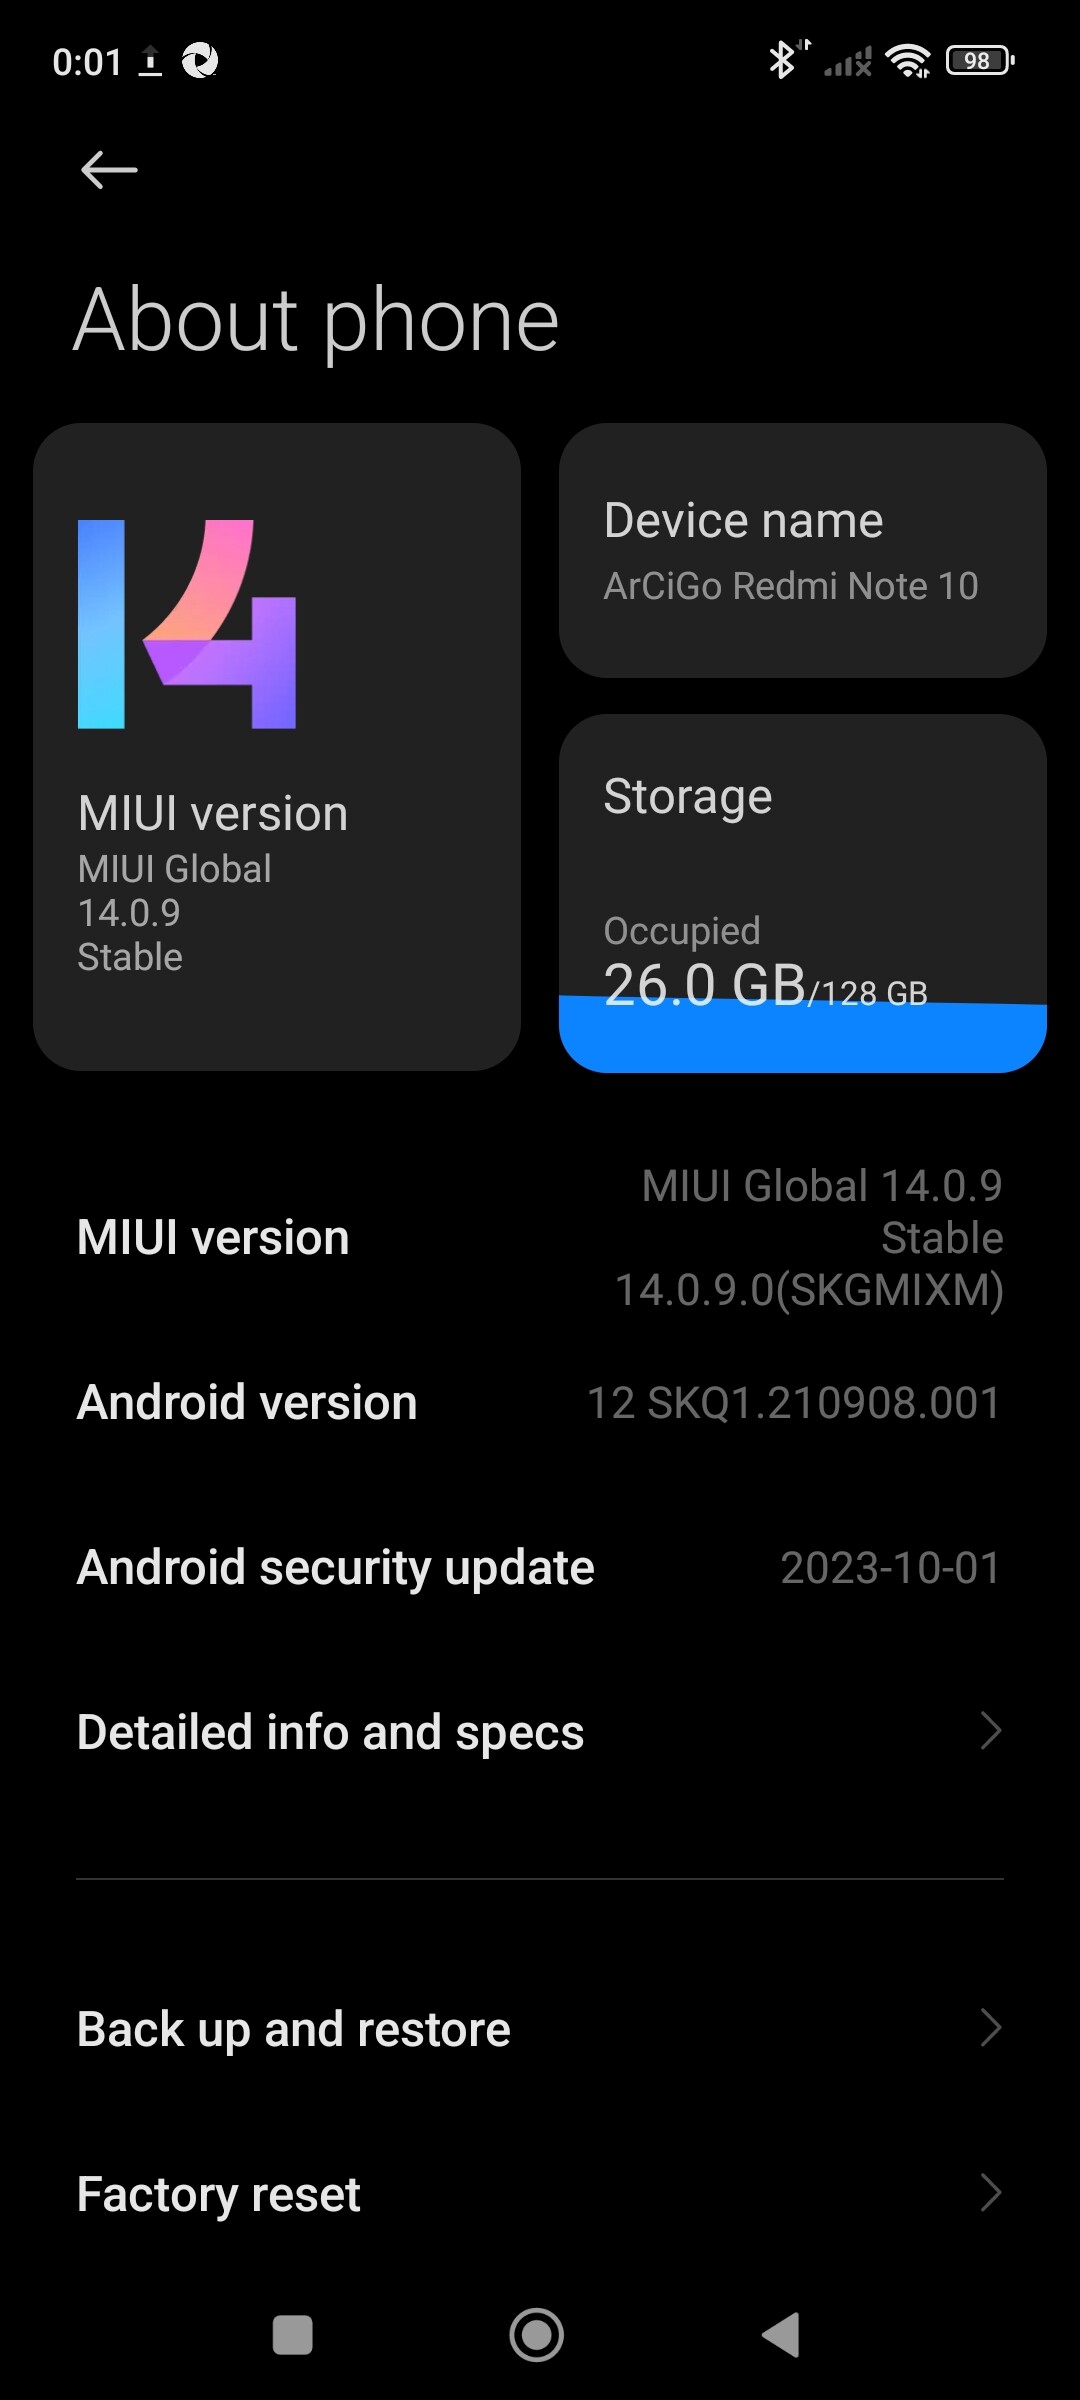
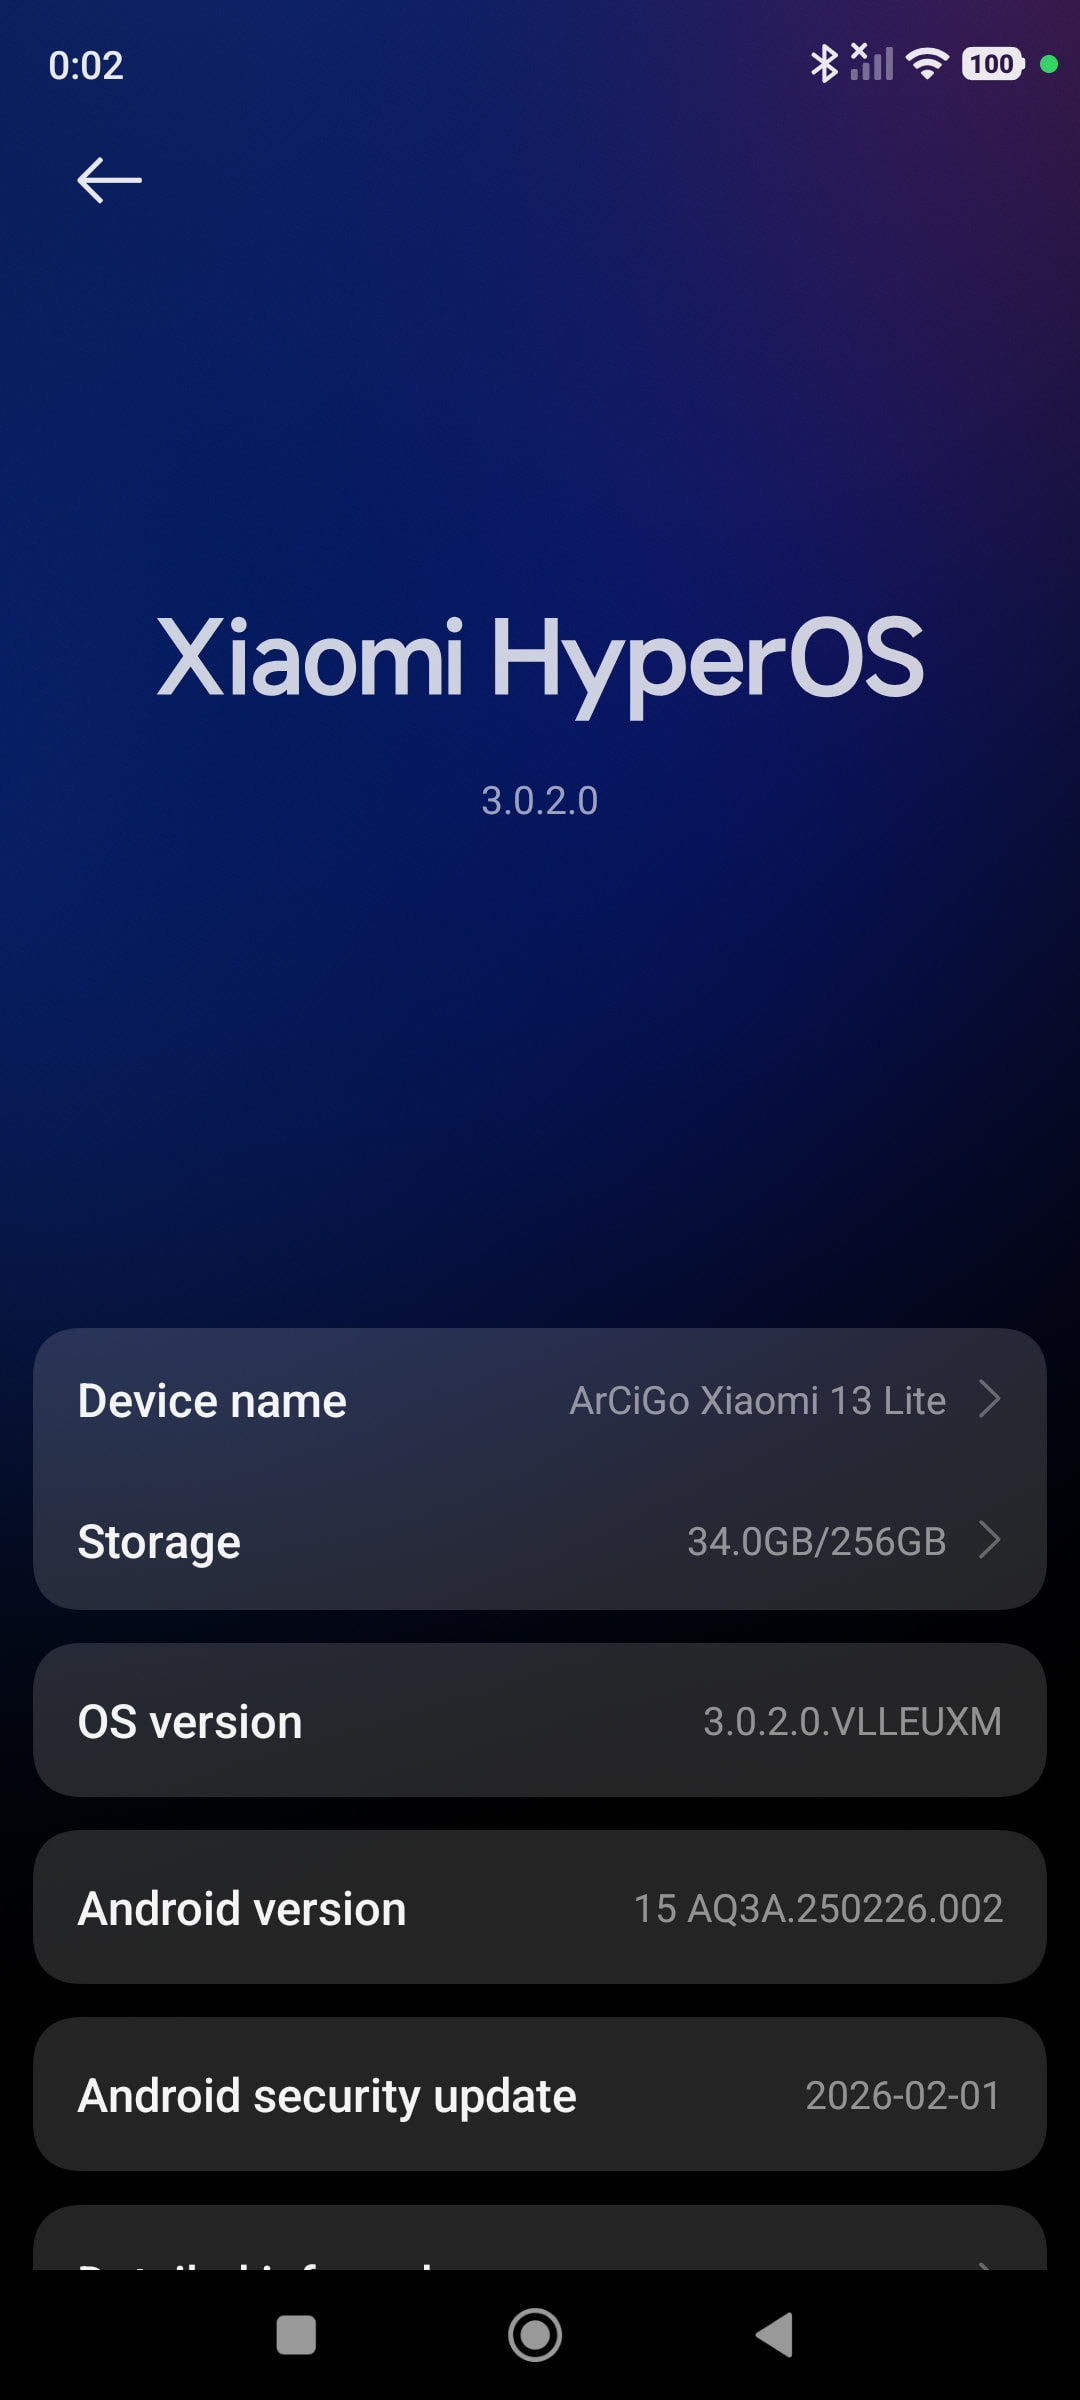
Recently I did a factory reset on two Xiaomi devices I have: a Redmi Note 10 and a Xiaomi 13 Lite. When I attempted to run the Appium Inspector on both devices, I got the following errors.-
cmp=com.ionicframework.conferenceapp/.MainActivity } within 45000 milliseconds. Perhaps the main thread has not gone idle within a reasonable amount of time? There could be an animation or something constantly repainting the screen. Or the activity is doing network calls on creation? See the threaddump logs. For your reference the last time the event queue was idle before your activity launch request was 1773088091488 and now the last time the queue went idle was: 1773088091488. If these numbers are the same your activity might be hogging the event queue. Check ` https://github.com/appium/appium-espresso-driver#troubleshooting\` regarding advanced session startup troubleshooting. when running “`http://127.0.0.1:4723/session`” with method “POST”\
Encountered internal error running command: A new session could not be created. Details: java.lang.RuntimeException: Could not launch intent Intent { act=ACTION_MAIN flg=0x14000000 cmp=com.ionicframework.conferenceapp/.MainActivity } within 45000 milliseconds. Perhaps the main thread has not gone idle within a reasonable amount of time? There could be an animation or something constantly repainting the screen. Or the activity is doing network calls on creation? See the threaddump logs. For your reference the last time the event queue was idle before your activity launch request was 1773088091488 and now the last time the queue went idle was: 1773088091488. If these numbers are the same your activity might be hogging the event queue. Check
 regarding advanced session startup troubleshooting.

io.appium.espressoserver.lib.handlers.exceptions.SessionNotCreatedException: java.lang.RuntimeException: Could not launch intent Intent { act=ACTION_MAIN flg=0x14000000 cmp=com.ionicframework.conferenceapp/.MainActivity } within 45000 milliseconds. Perhaps the main thread has not gone idle within a reasonable amount of time? There could be an animation or something constantly repainting the screen. Or the activity is doing network calls on creation? See the threaddump logs. For your reference the last time the event queue was idle before your activity launch request was 1773088091488 and now the last time the queue went idle was: 1773088091488. If these numbers are the same your activity might be hogging the event queue.

at io.appium.espressoserver.lib.handlers.CreateSession.handleInternal(CreateSession.kt:54)

at io.appium.espressoserver.lib.handlers.CreateSession.handleInternal(CreateSession.kt:29)

at io.appium.espressoserver.lib.handlers.RequestHandler$DefaultImpls.handle(RequestHandler.kt:57)

at io.appium.espressoserver.lib.handlers.CreateSession.handle(CreateSession.kt:29)

at io.appium.espressoserver.lib.handlers.CreateSession.handle(CreateSession.kt:29)

at io.appium.espressoserver.lib.http.Router.route(Router.kt:232)

at io.appium.espressoserver.lib.http.Server.serve(Server.kt:78)

at fi.iki.elonen.NanoHTTPD$HTTPSession.execute(NanoHTTPD.java:945)

at fi.iki.elonen.NanoHTTPD$ClientHandler.run(NanoHTTPD.java:192)

at java.lang.Thread.run(Thread.java:1119)

Caused by: java.lang.RuntimeException: Could not launch intent Intent { act=ACTION_MAIN flg=0x14000000 cmp=com.ionicframework.conferenceapp/.MainActivity } within 45000 milliseconds. Perhaps the main thread has not gone idle within a reasonable amount of time? There could be an animation or something constantly repainting the screen. Or the activity is doing network calls on creation? See the threaddump logs. For your reference the last time the event queue was idle before your activity launch request was 1773088091488 and now the last time the queue went idle was: 1773088091488. If these numbers are the same your activity might be hogging the event queue.

at androidx.test.runner.MonitoringInstrumentation.startActivitySync(MonitoringInstrumentation.java:550)

at io.appium.espressoserver.lib.helpers.ActivityHelpers.startActivity(ActivityHelpers.kt:113)

at io.appium.espressoserver.lib.handlers.CreateSession.handleInternal(CreateSession.kt:43)

... 9 more
I’m running the Appium Server in the following way (since I’m trying to automate an Ionic app): appium server --allow-insecure espresso:chromedriver_autodownload.
My capabilities in the Appium Inspector are the following ones.-
{
"platformName": "Android",
"appium:automationName": "Espresso",
"appium:platformVersion": "15",
"appium:deviceName": "ArCiGo's Xiaomi 13 Lite ",
"appium:app": "~/conference-app-android.apk",
"appium:chromedriver_autodownload": true,
"appium:udid": "[My_Awesome_UDID]"
}
I can see that the app is installed on both devices, but the Appium Inspector doesn’t open the app. Before the factory reset, I was able to use the Appium Inspector on the Xiaomi 13 Lite without any problems.
Thanks in advance for your support. Have a nice day!
Notes.-
- I allowed my Mac to recognize the devices.
- I have a Samsung S24 Ultra, and there aren’t any problems. Everything runs smoothly.
- For some unknown reason, I can upload videos here, but on both devices I have enabled the USB debugging and the verification of apps installed through USB.